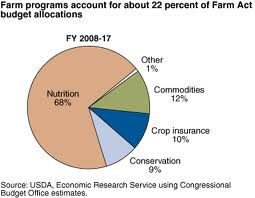
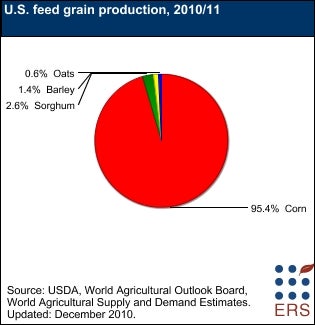
Farm Bill Expenditure & U.S. Feed Grain Production Charts
They say “a picture is worth 1000 words”. I’m not sure that’s always true – I’m rather pro-words, myself. But these two pie charts from USDA ERS tell important stories about where Farm Bill expenditures go, and the dominance of corn in U.S. feed grain production.


 Your Privacy Choices
Leave a comment