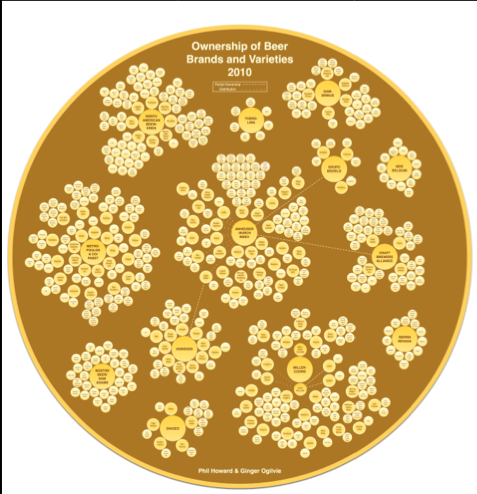
Concentration in the Beer Industry Chart – Phil Howard
Who owns the beer you drink? Here is another great chart showing concentration in the food (and beverage) industry from Phil Howard and Ginger Ogilvie.
The image below simply gives you a taste (not a literal taste, which in my opinion is unfortunate in a number of instances). To view the fully interactive image, go to https://www.msu.edu/~howardp/beerownership.html.
This is really an interesting view of how we are often led to think that the food and drinks we purchase and consume are not produced by a huge manufacturer.
If you like this kind of stuff, you should also check out Phil’s article on Consolidation in the Seed Industry (scary stuff), as well as his charts on Concentration in the Organic Industry, as well as Concentration in the Non-Alcoholic Beverage Industry, and the many publications and charts about the food system on his website.
To view the interactive image go to: https://www.msu.edu/~howardp/beerownership.html


 Your Privacy Choices
Leave a comment